
Apache Superset 6.1.0: Stratum Matrix Heatmap & Density Grid
Enterprise matrix heatmap plugin for Apache Superset 6.1.0 designed to visualize high-cardinality two-dimensional intersections such as hospital ward occupancy by hour-of-day, diagnostic wait times across territorial districts, and laboratory turnaround bottlenecks.
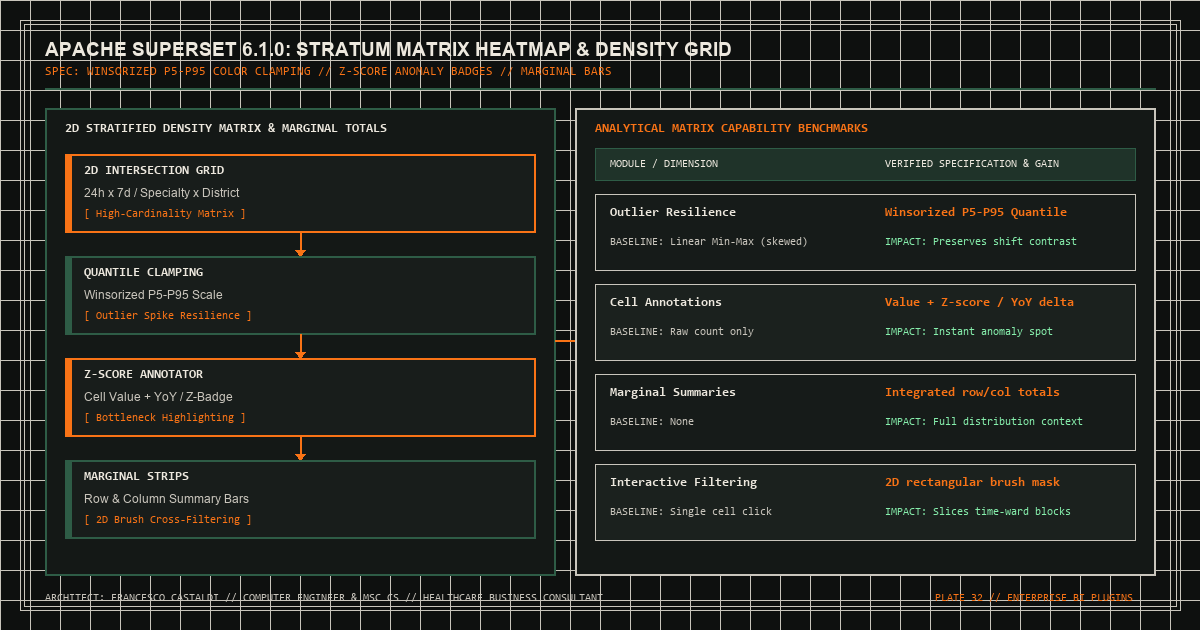
High-Density 2D Matrix Analytics
When analyzing hospital congestion (e.g., 24 hours x 7 days arrival density or 30 specialties x 12 districts wait-time matrices), extreme outliers can wash out linear color scales and obscure systemic operational patterns.
Analytical Matrix Comparison
| Feature / Metric | Standard Heatmap | Stratum Matrix Heatmap | Operational Impact |
|---|---|---|---|
| Outlier Resilience | Min-Max linear (skewed by spikes) | Quantile / Winsorized P5-P95 scale | Preserves contrast across normal shifts |
| Cell Annotations | Raw number only | Value + YoY delta or Z-score indicator | Immediate bottleneck identification |
| Row / Column Marginal Totals | None | Integrated marginal summary bars | Shows both cell density and row totals |
| Interactive Selection | Single cell click | Rectangular brush selection mask | Filters dashboard by time-ward block |
*Table 1: Stratum Matrix Heatmap Capabilities*
Core Capabilities
- Winsorized Color Interpolation: Prevents single-day data spikes from flattening the color gradient across the rest of the matrix. - Marginal Summary Strips: Displays aggregated row and column totals directly adjacent to the 2D grid.