Developing Visualization Plugins for Apache Superset
Abstract: Step-by-step guide to extending Apache Superset (v6.1.0) with custom React visualizations, leveraging the plugin architecture and native cross-filters.
Why Get Your Hands Dirty with Custom Plugins?
Apache Superset is a phenomenal BI platform, but its native charts are sometimes not enough. Complex corporate dashboards require tailored visualizations. The solution? Create custom React plugins to inject proprietary charts directly into the heart of Superset.
Architecture and Integration
Plugins in Superset are not isolated iframe widgets. They are first-class React components integrated via Webpack and TypeScript, receiving data from the native query engine (Flask/SQLAlchemy).
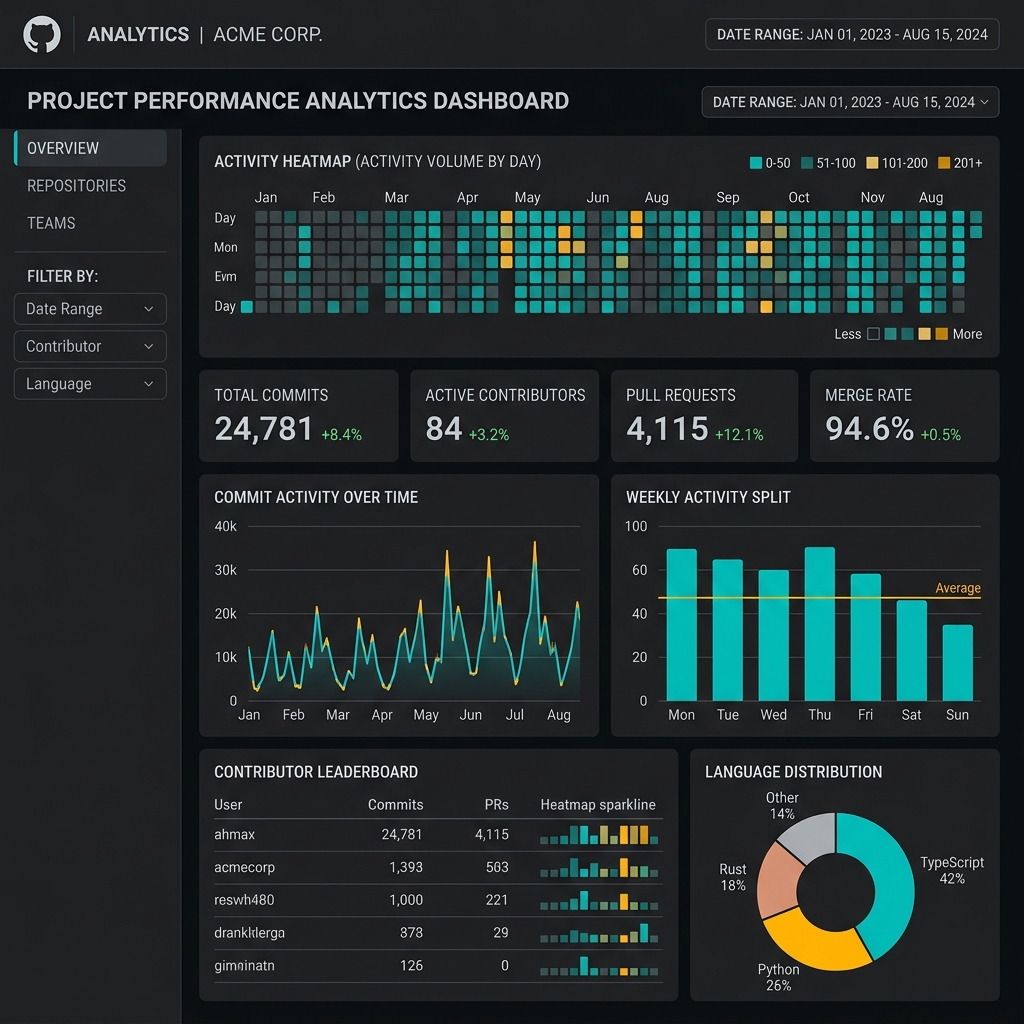
I developed a Calendar Heatmap (similar to GitHub commits) to map the intensity of an event flow day by day.
Technical Details
Building a plugin requires adhering to very strict interfaces.
| Plugin Component | Responsibility |
|---|---|
ControlPanel | Builds the side UI interface to let the user choose columns and metrics. |
BuildQuery | Translates the UI configuration into formatted queries for Superset's Python backend. |
TransformProps | Adapts the raw database JSON into props digestible by the React component. |
By registering the plugin in the central registry, the new Chart appears in the native dropdown, indistinguishable from Superset's original features. A dirty Webpack configuration job, but of invaluable architectural value.